Author: Ayush Chauhan, Associate Data Engineer
Introduction
In the midst of all of the bad news in COVID era, there are good news reports of the important work done by data engineers and data scientists to get the data of all COVID cases around the world together and provide useful insights which will be useful for pan professionals.
The objective of this article is to focus on a use case that demonstrates the integration between daily changing Source, Azure Databricks and Power BI to deliver insights and data visualizations using a publicly available COVID-19 dataset. While Azure Databricks provides the distributed computing power to process and transform complex datasets, Power BI is a fitting recipient of the transformed dataset that surfaces these insights to business users.
Source
The latest available public data on the geographic distribution of COVID-19 cases worldwide from the European Center for Disease Prevention and Control (ECDC). Each row/entry contains the number of new cases reported per day and per country or region.
Before we start with our exercise, we will need to have the following prerequisites:
- You need to have an active Azure Subscription.
- Azure Databricks – You need to set up both Databricks service and cluster in Azure, you can go over the steps in this article. As shown in this article, we have created a Databricks service.
- Power BI Subscription
Let’s go ahead and demonstrate the data load into Databricks using Python notebooks from the source mentioned above.
STEP 1: Create Azure Databricks
The next step is to create a Databricks Workspace. You can think of the workspace like an application that you are installing within Azure, where you will access all of your Databricks assets. Follow these steps to create a workspace:
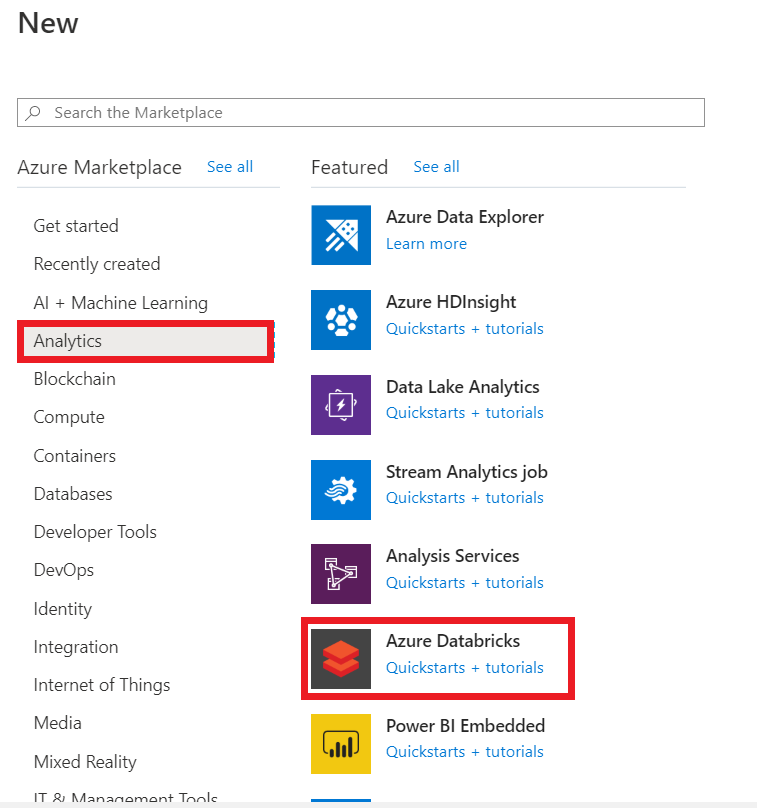
- On the Azure home screen, click ‘Create a Resource’.
- In the ‘Search the Marketplace’ search bar, type ‘Databricks’ and you should see ‘Azure Databricks‘ pop up as an option. Click that option.
- Click ‘Create’ to begin creating your workspace.
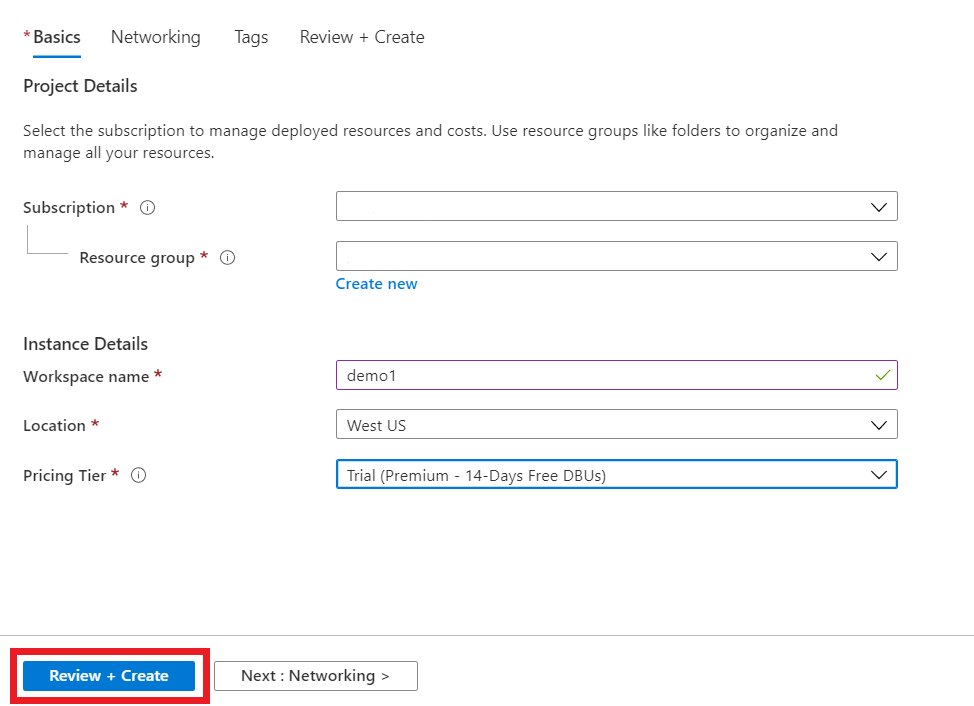
Use the same resource group you created or selected earlier. Then, enter a workspace name. Remember to always stick to naming standards when creating Azure resources, but for now, enter whatever you would like. You can keep the location as whatever comes default or switch it to a region closer to you. For the pricing tier, select ‘Trial’. Finally, select ‘Review and Create‘. We can skip-networking and tags for now which are for more advanced set-ups.
- This should bring you to a validation page where you can click ‘create’ to deploy your workspace. This will bring you to a deployment page and the creation of the workspace should only take a couple of minutes
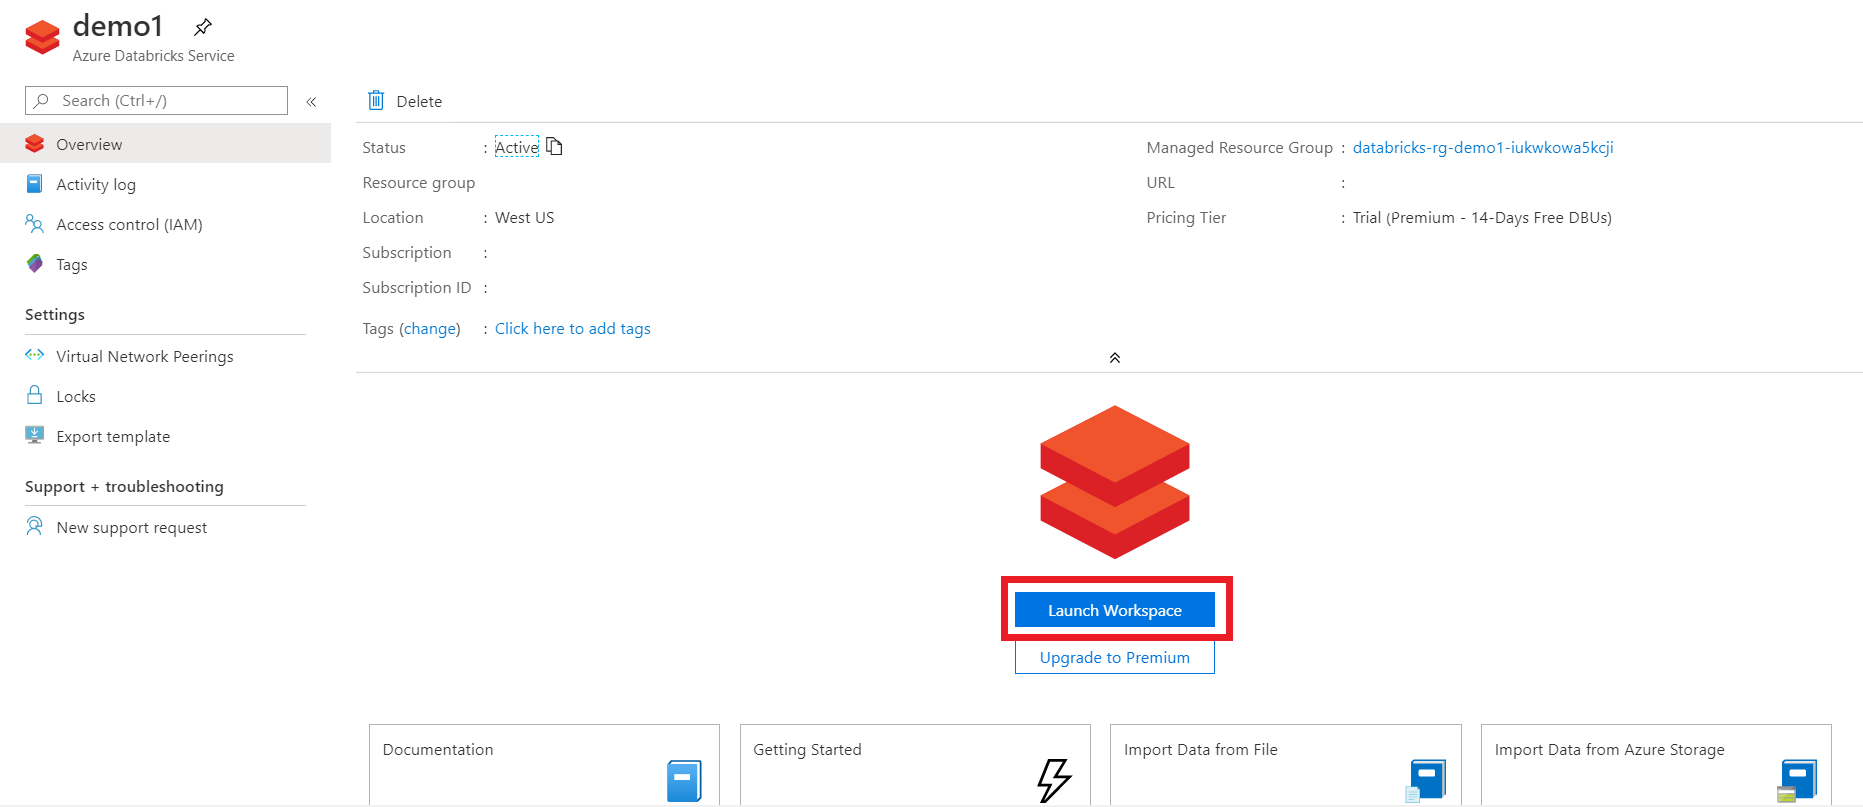
- Once the deployment is complete, click ‘Go to resource‘ and then click ‘Launch Workspace’ to get into the Databricks workspace.
- Create a Workspace (Notebook) with Python or your choice of language for performing analysis.
STEP 2: Start Scripting in Notebook.
- Import relevant libraries and fetch data from the source according to its data type.
- Digging the data to get useful and relevant analytical data
-
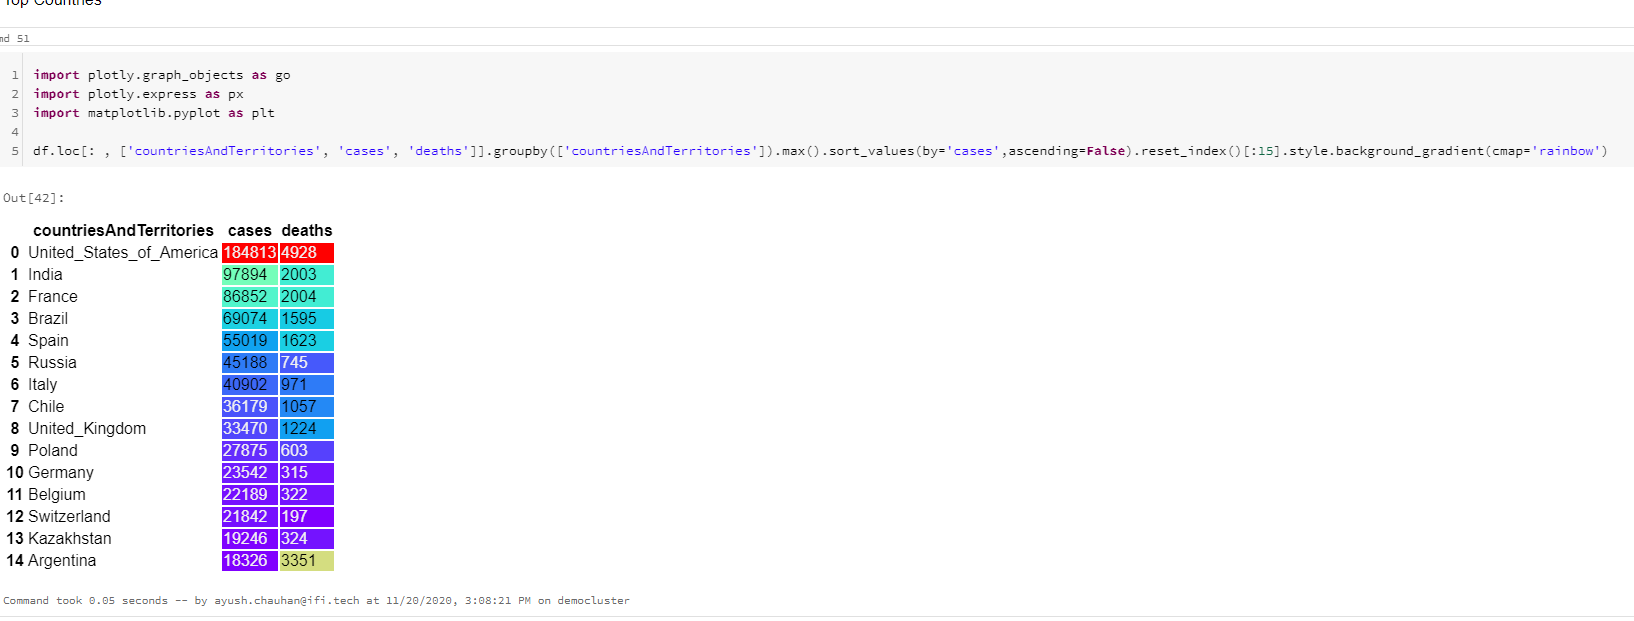
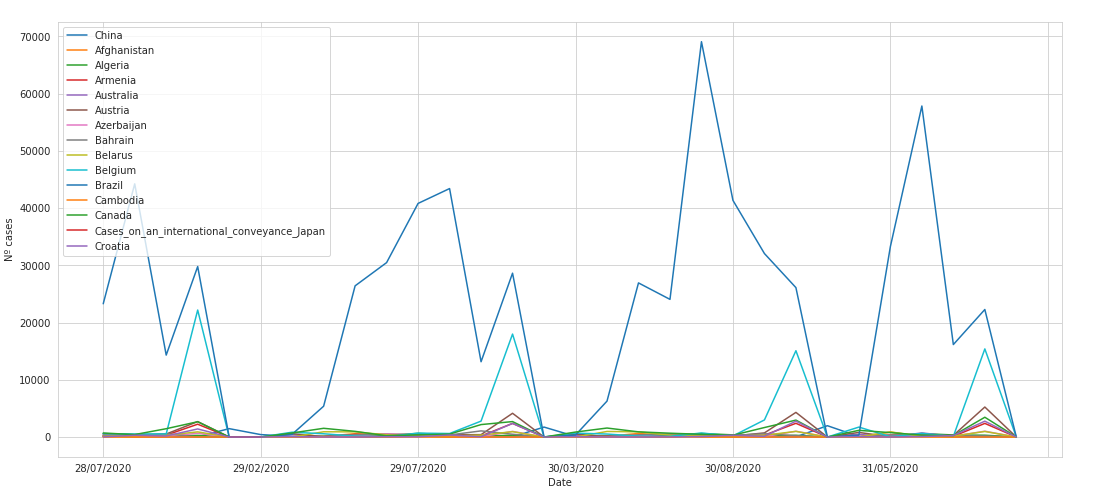
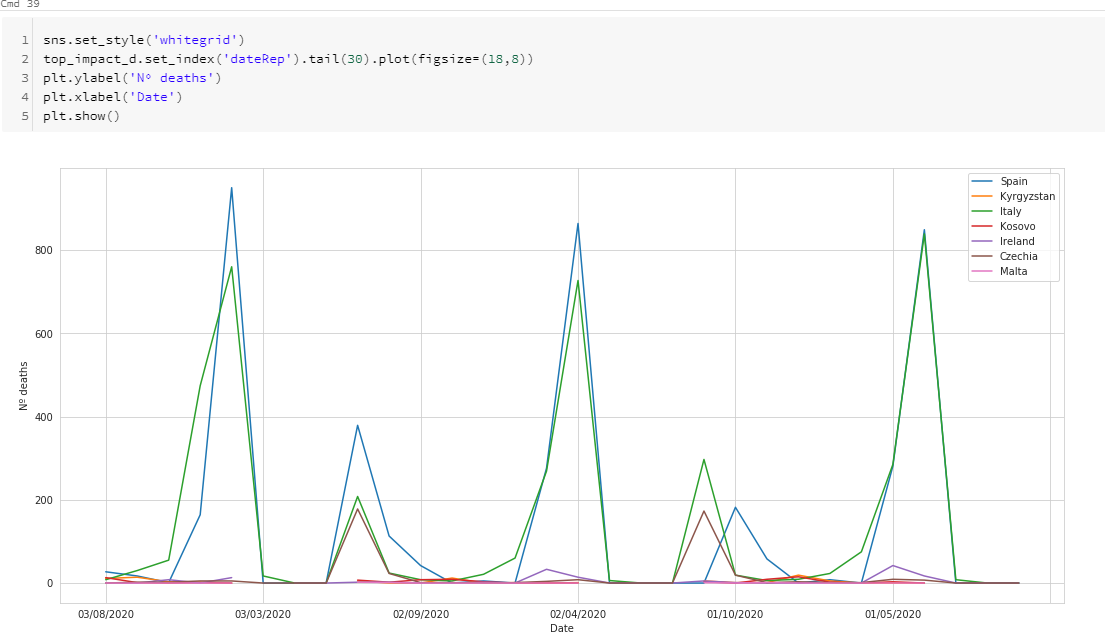
- Top Countries with cases and deaths.
-
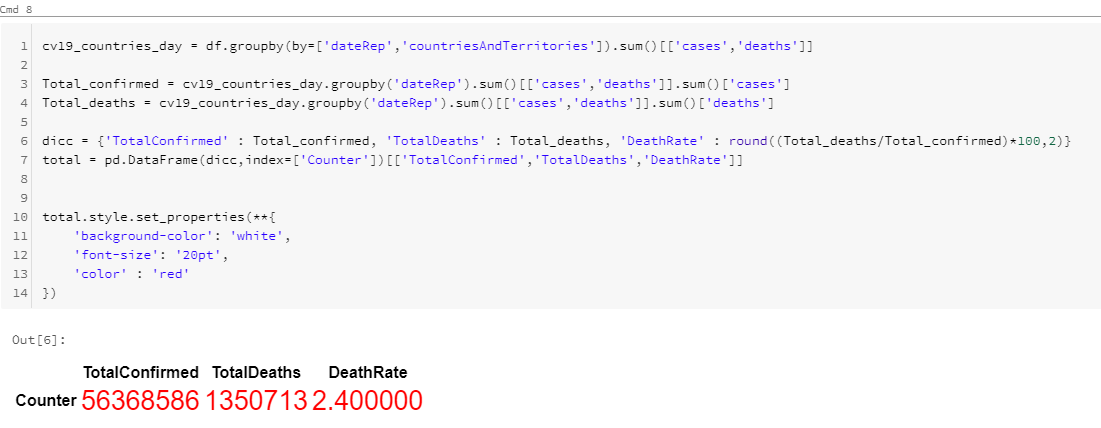
- Calculating total cases, deaths and death rate around the globe.
-
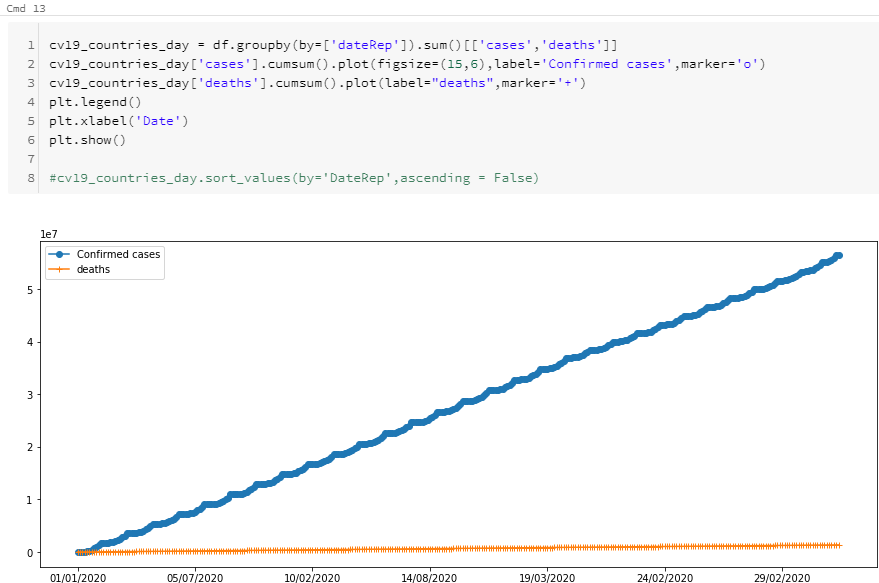
- Visualizing total cases and deaths with a timeline.
-
- Calculating Death Ratio for top countries.
-
- Calculating global change rate per day.
-
-
- Global Rate Change for cases per day.
-
-
-
- Global Rate Change for deaths per day.
-
-
- Calculating Change rate for top countries only.
-
-
- Top countries Rate Change for cases.
-
2. Top countries Rate Change for deaths.
-
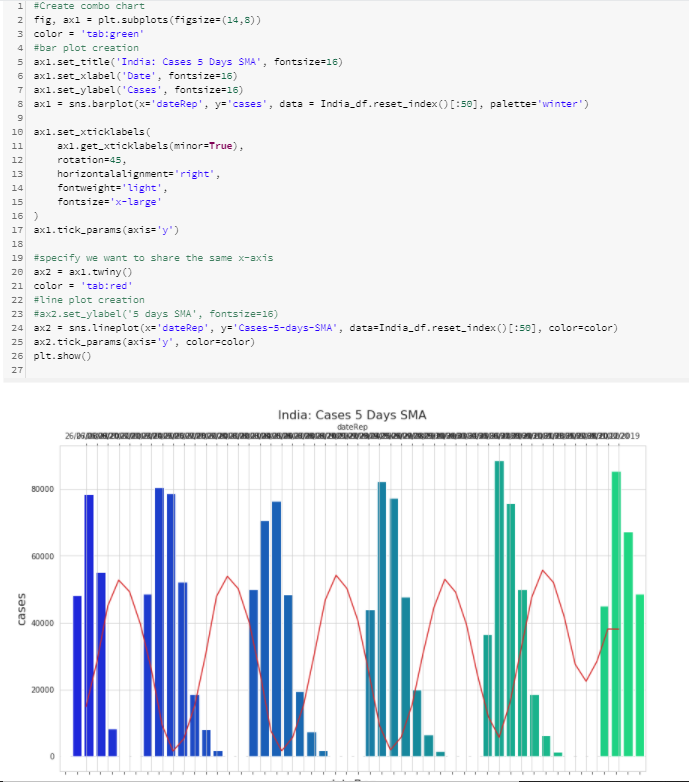
- Fetching Country particular data ( e.g. INDIA).
-
- Fetching Continent particular data.
-
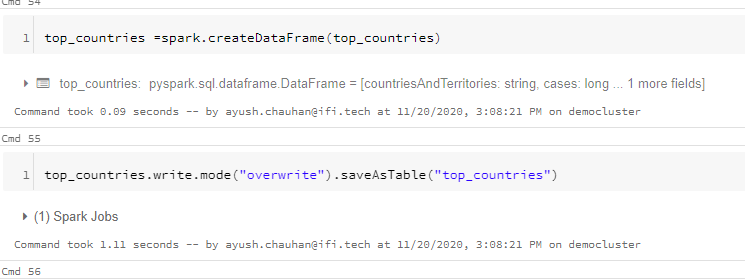
- Save the relevant data frames as tables.
-
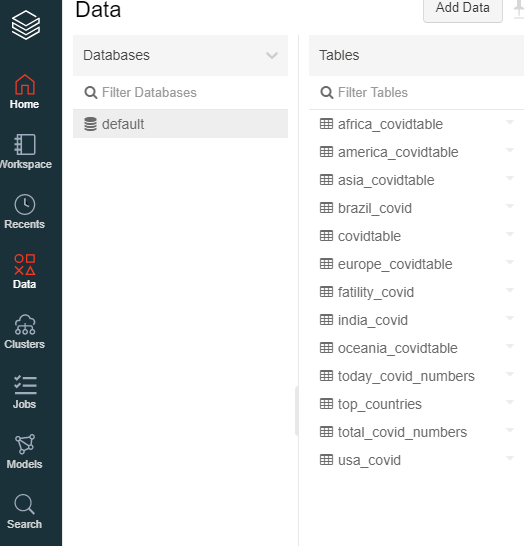
- Check the newly created tables by clicking ‘DATA’ in the left panel of data bricks workspace.
-
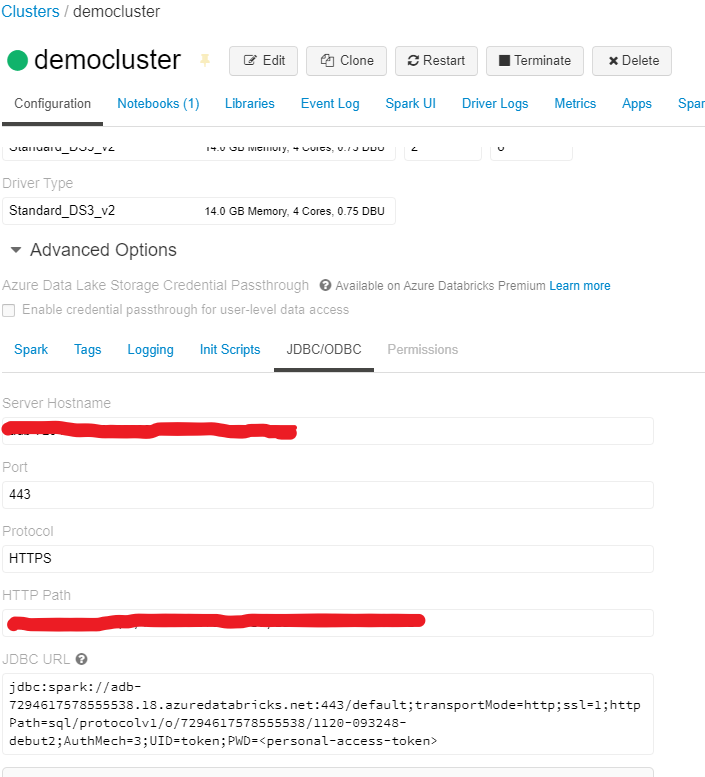
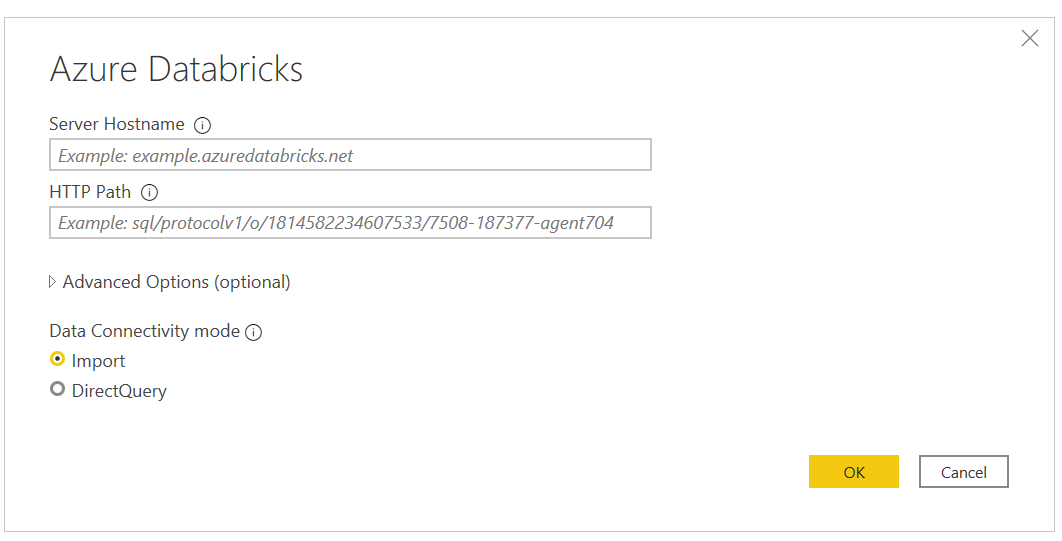
- Locate and store the credentials from data bricks clusters(Server Hostname & HTTP Path).
Step 3: Data brick Job Scheduling
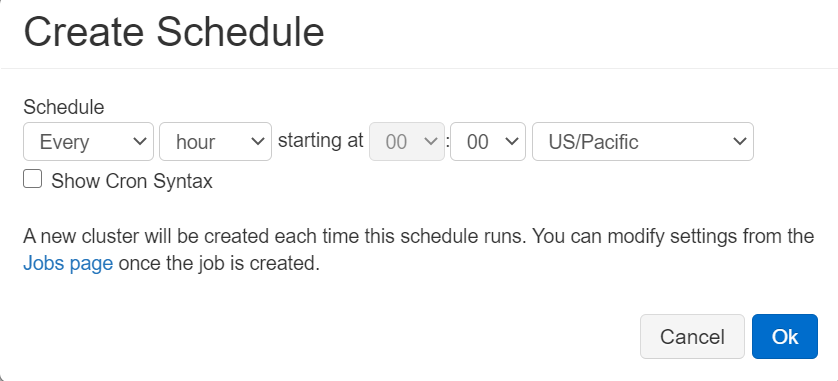
The very import scope of this article is to capture the daily changing data, then we have to run every other command for every day when a new data will be in our source to avoid this, we will automate the whole process and schedule a job to run our notebook with an interval of a day, so it will check for a new file and apply all the commands accordingly.
Click on (calendar like symbol), on the top-right corner of your notebook.
Step 4: Connecting Power Bi to your Databricks.
- Click on’ Get Data’ and search for ‘Azure data bricks’ to add data bricks credentials (Server Hostname & HTTP Path)
- Click on ‘DATA’ to get a view and validation for the tables in Power BI.
- Start making insightful reports by applying different filters and visuals, a sample report to get an overview.
Here you can select Individual countries or group of them to assign them with a particular date with the help of slicers to view analytics accordingly.
This is the end of this article, we successfully automate the process of Loading, Transforming and Writing the data process from a web source and then migrating the processed data to Power BI, it will also read new data and apply all the transformations on it with an interval that was defined by the developer.
Thank you and feel free to try out some different transformations in data bricks and create some awesome visuals with Power BI.


